Section I · The Japanese Candlestick Bible · Chapter 9
Candles in real trading
How to combine candles with levels, trend, Fibonacci, RSI divergence, multiple timeframes and liquidity – and the specifics of gold.
Video lesson with voice-over and charts · 4 minEnglish subtitles
Candle patterns are a timing tool – they tell you when. Levels and the trend tell you where and in which direction. The best trades are born when several factors line up (confluence).
1. Candles + support and resistance
Draw the horizontal levels on D1 and H4 – previous highs and lows, zones where price has reacted many times. Look for bullish patterns only at support and bearish ones only at resistance. This one rule will eliminate most losing trades.
2. Candles + trend and moving averages
In a strong trend, look for continuation patterns and reversal patterns on the pullbacks, not against the trend. Example: in a daily uptrend in gold, you wait for a pullback to the 50 EMA on H4 and a bullish engulfing there – that's an entry with the trend and a good risk-reward ratio.
3. Candles + Fibonacci
The 38.2%, 50% and 61.8% retracement levels are natural zones for a pullback to reverse. A hammer or a morning star at 61.8% of the last impulse is a classic setup.
4. Candles + RSI divergence
If price makes a new high but RSI makes a lower high (bearish divergence), momentum is weakening. An evening star or a shooting star at that moment is much more reliable. The reverse applies to bullish divergence at the bottom.
5. Multi-timeframe analysis
Use three timeframes: a higher one (D1) for direction, a middle one (H4/H1) for the pattern and a lower one (M15/M5) for a precise entry. Example: D1 – uptrend; H1 – bullish engulfing at support; M15 – entry after the first pullback with a stop below the engulfing.
6. Liquidity – the modern reading of candles
Big players need liquidity – the stop-losses of other traders, which sit above the highs and below the lows. That's why many of the strongest candles (hammer, shooting star, engulfing) form exactly when price sweeps a previous high or low and immediately comes back. The long wick in this case is the footprint of the collected liquidity. When you see a candle like that – that's the modern explanation of the old Japanese patterns.
7. XAUUSD specifics
- Sessions: the most reliable signals come at the London and New York opens. Patterns in the Asian session are often false because of the low liquidity.
- News: NFP, CPI, Fed decisions create huge candles with long wicks. Don't trade patterns formed in the first minutes after a news release – wait for the market to calm down.
- Volatility: gold moves tens of dollars within hours. Always place the stop-loss with a buffer (spread + a few dollars) beyond the wick.
- Round numbers: levels like 4000, 4050, 4100 act as magnets and barriers – signals there are stronger.
- Gaps: there are almost no gaps during the week – you'll see gap patterns mainly at the Sunday open. So accept “stars” even without a perfect gap.
Exercises
Test yourself on the chart
0 of 4 correct
1Where do you look for bullish patterns?
2D1 is in an uptrend, and the pullback on H1 ends with a “Bullish Engulfing”. You go long (buy) at the close. Where do you put the stop-loss?
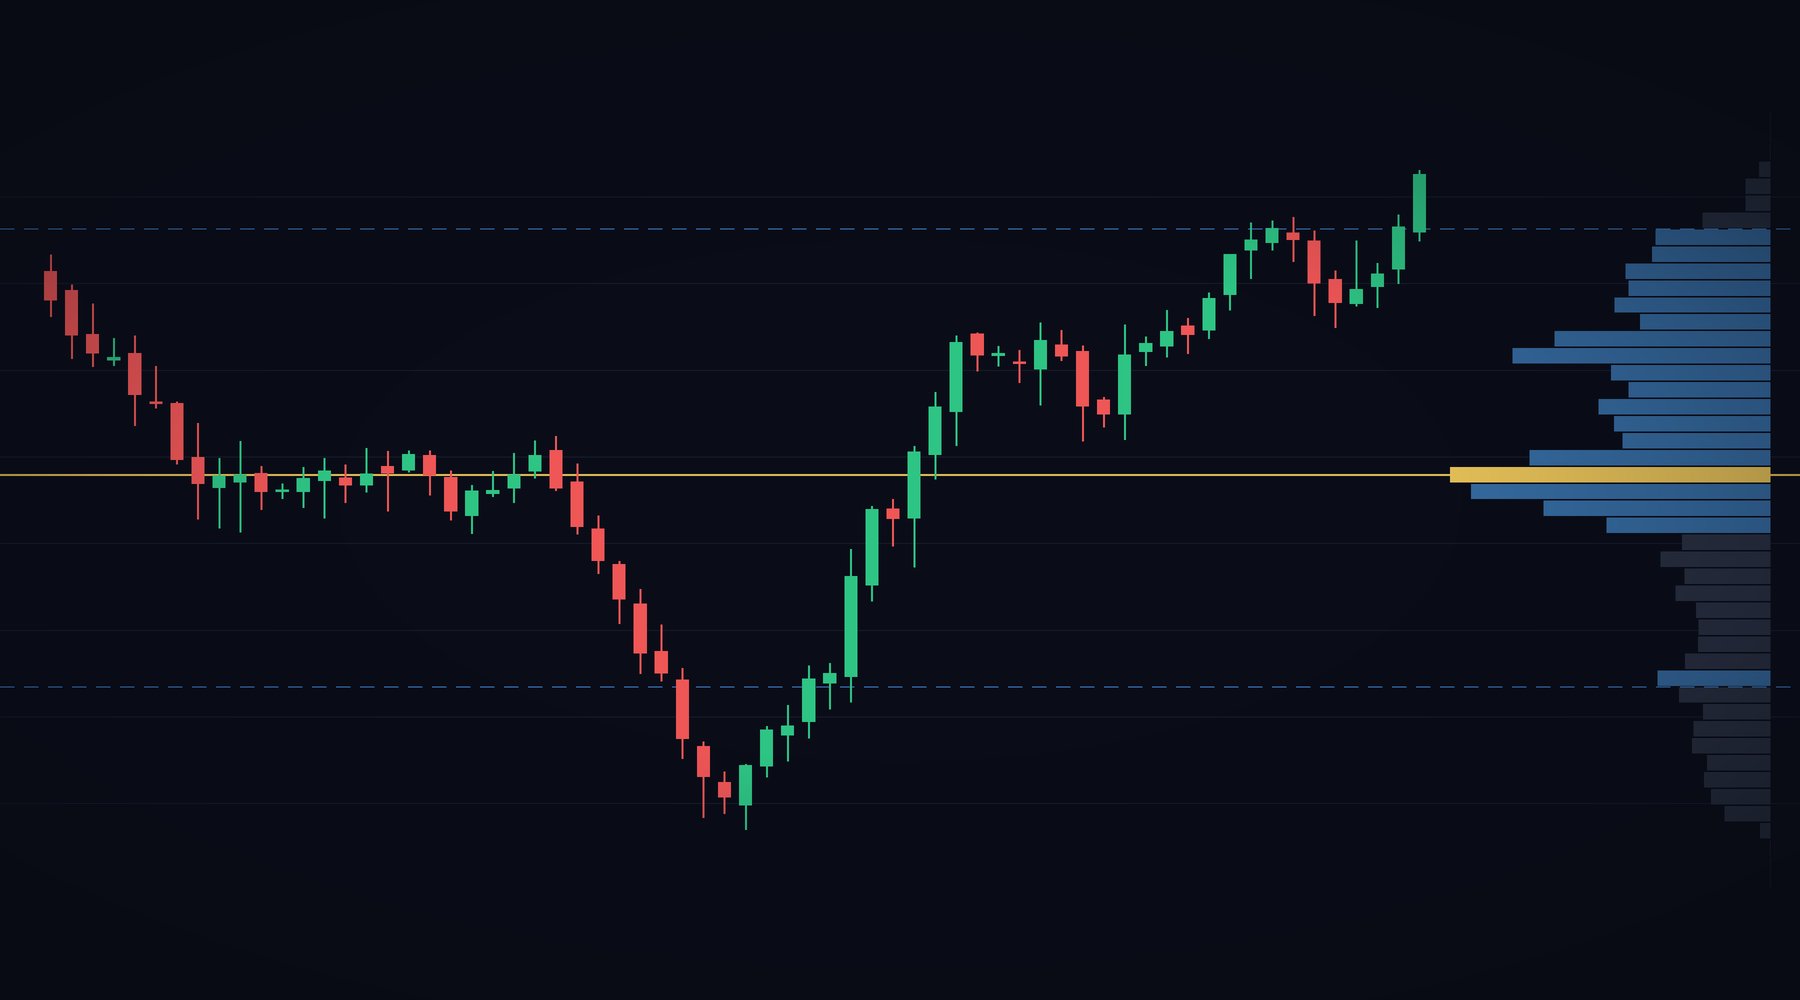
Tap the chart where you would put the stop-loss.
3Tap the candle that sweeps the previous low and closes back above it.
Tap a candle on the chart.
4When do the most reliable signals in gold come?
Key points
- Candles give the timing; levels and trend tell you where and in which direction.
- Look for bullish patterns only at support and bearish ones only at resistance.
- The strongest candles often appear after a liquidity sweep.
- In gold: the best signals come at the London and New York opens; always give the stop a buffer.