Section I · The Japanese Candlestick Bible · Chapter 3
How to read candles
The five questions for every candle: body size, where it closes, wick length, relation to the previous candles and the timeframe.
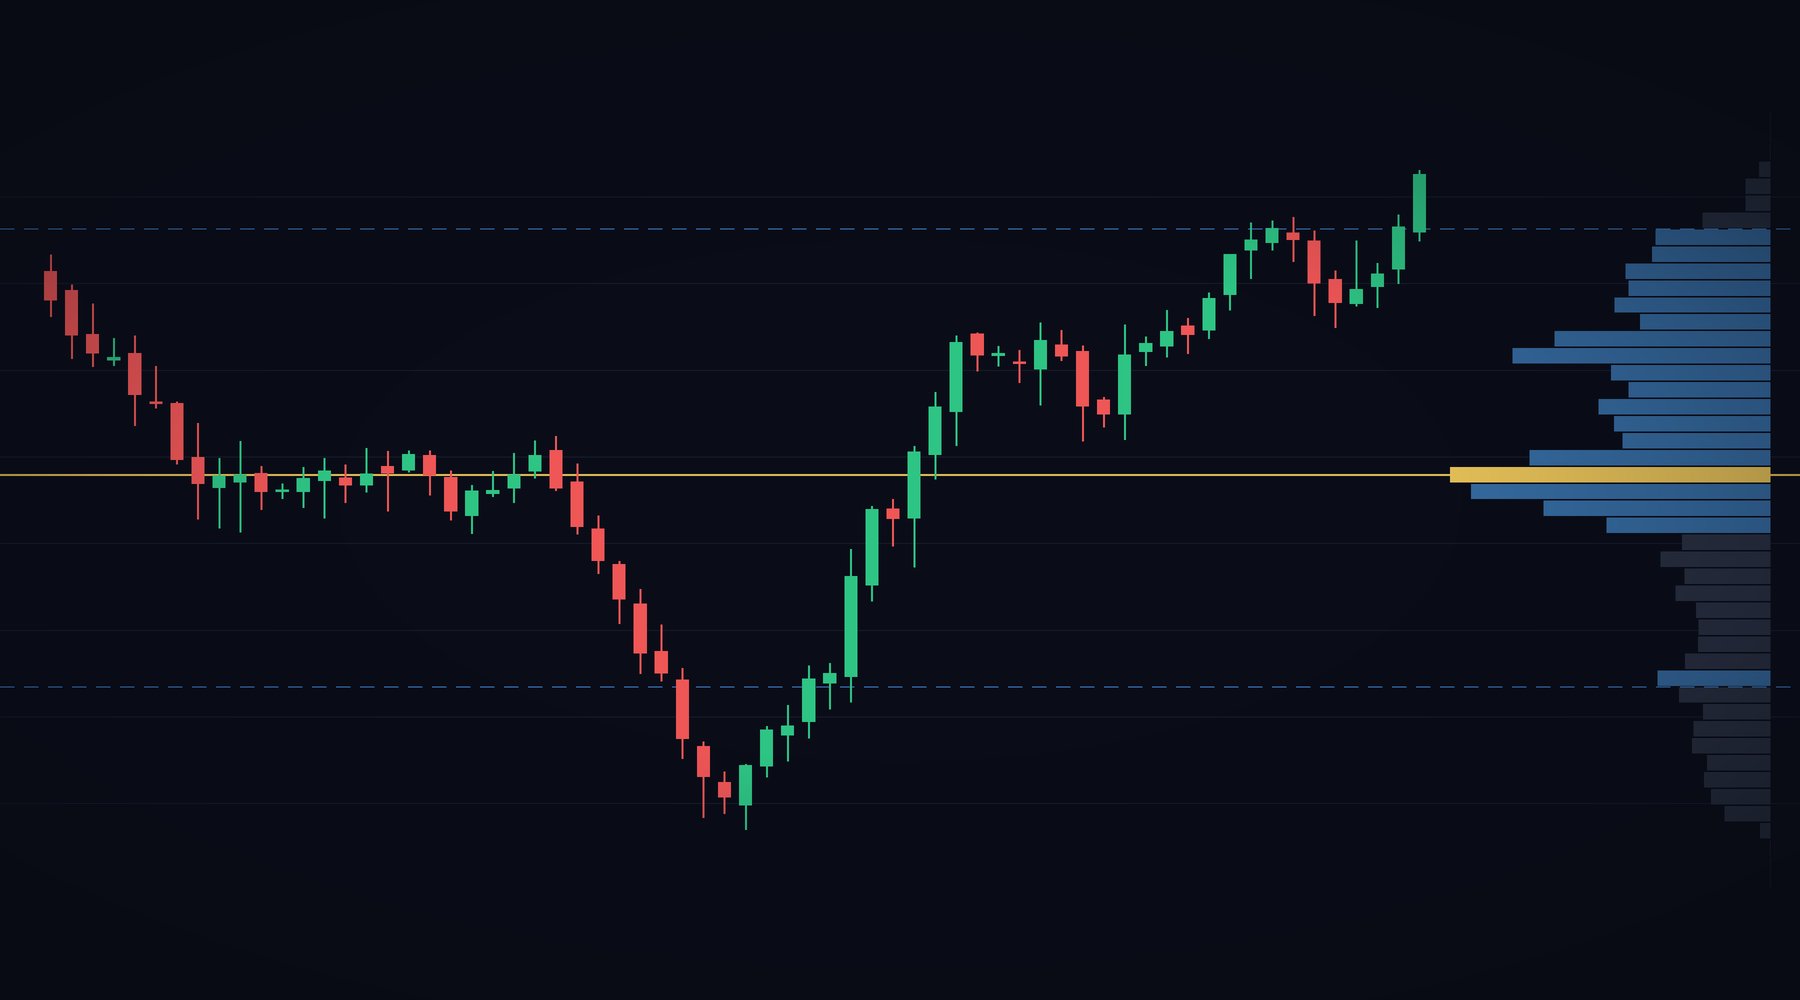
Video lesson with voice-over and charts · 3 minEnglish subtitles
Before we learn patterns, we need to be able to “read” every single candle. There are five questions you should ask yourself with every candle.
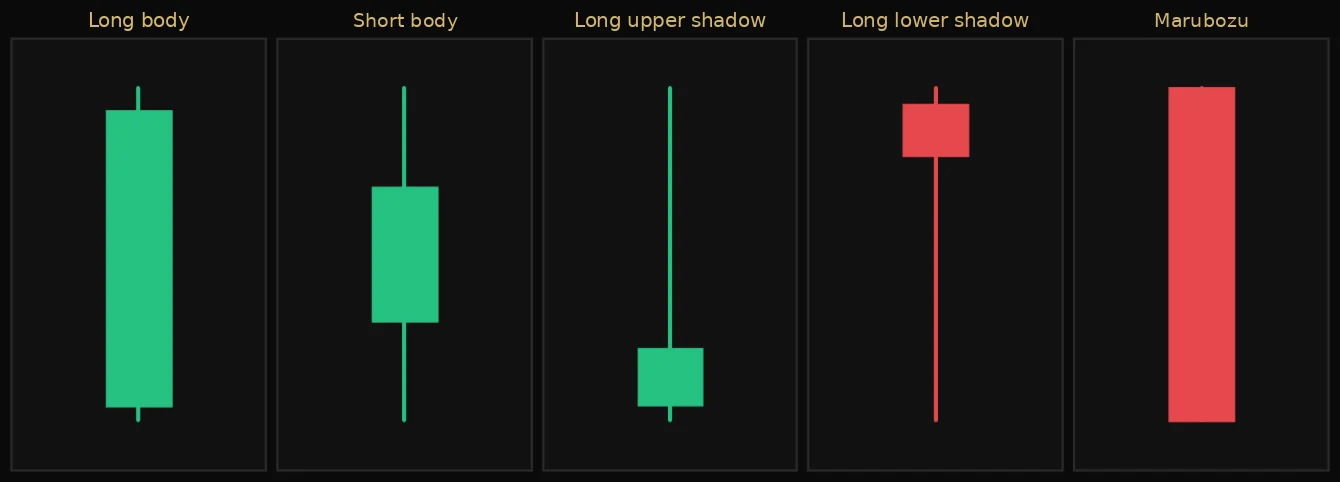
1. How big is the body?
A long body shows strong conviction – one side dominated. A short body shows balance or hesitation. Always compare with the average candles of the last 10–20 periods, not in absolute values: a $5 candle on gold is big on M5 and small on D1.
2. Where is the close relative to the range?
A close in the upper quarter = buyers are in control until the end. A close in the lower quarter = sellers are in control. A close in the middle = indecision. This is perhaps the most important information in a candle.
3. How long are the wicks?
A long wick is rejection. Long upper wick = the market tried higher prices and refused them. Long lower wick = the market tried lower prices and refused them. Wicks at key levels are among the strongest signals in all of technical analysis.
4. How does the candle compare with the previous ones?
A candle that engulfs the previous one shows a change of control. A candle that sits inside the previous one (inside bar) shows contraction and preparation for a move. A candle that is much bigger than average shows a big player stepping in.
5. Which timeframe am I on?
The higher the timeframe, the more reliable the candle. A daily candle sums up thousands of trades over a whole day, while a one-minute candle can be “distorted” by a single large order. Recommendation: spot patterns on H1, H4 and D1, and use the lower timeframes for a precise entry.
Candles and timeframes
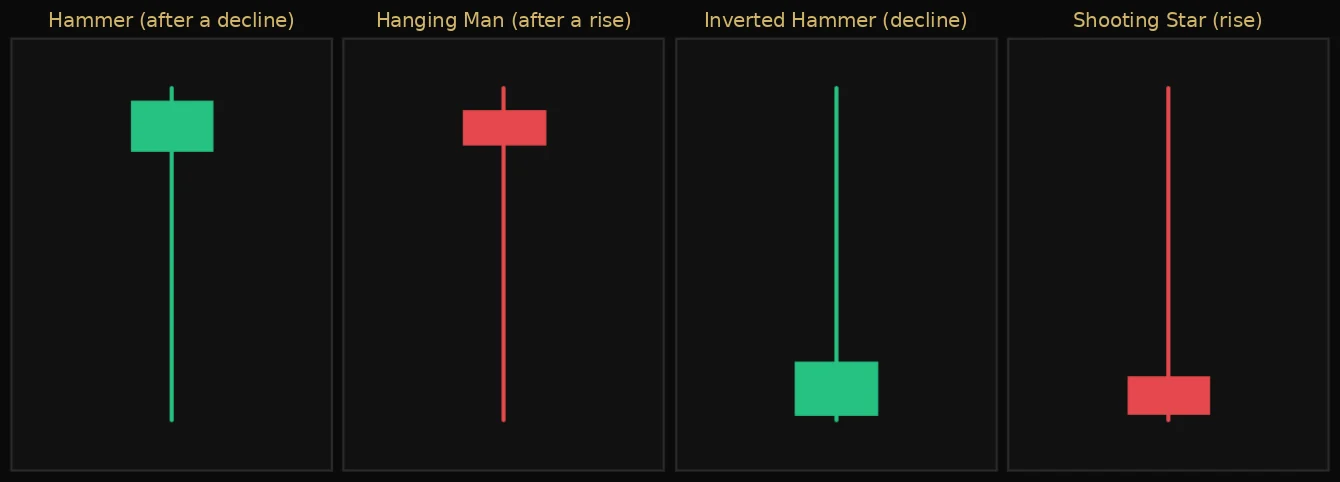
One daily candle contains 24 hourly candles. A hammer on the daily chart may look on the hourly chart like a drop followed by a strong V-shaped bounce. This is important: patterns on a higher timeframe are “assembled” from moves on the lower one. When you see a pattern on H4, look at H1 – you'll understand its story in detail.
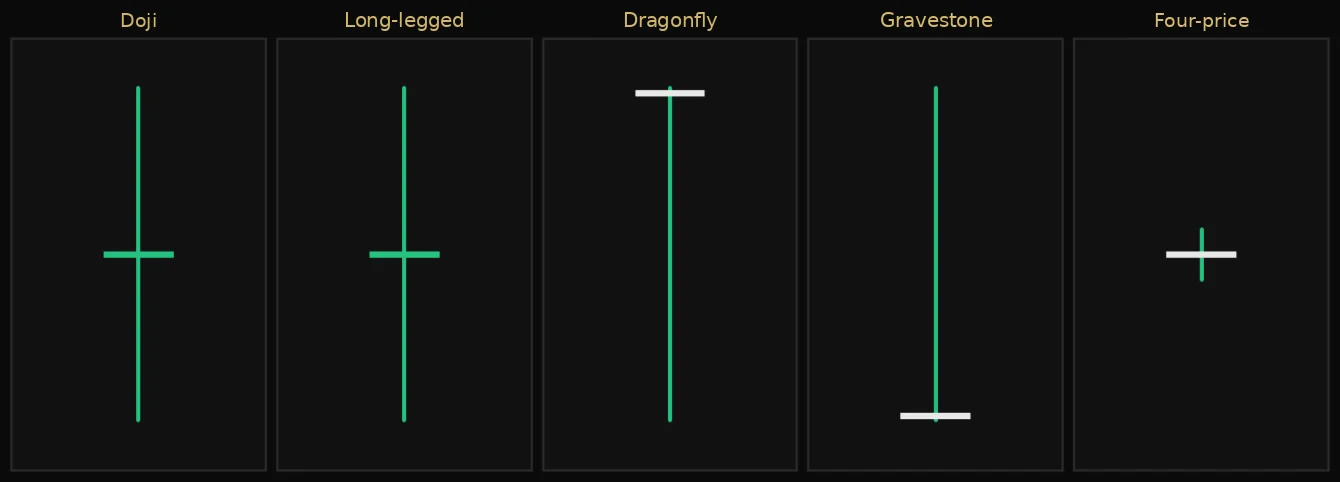
The doji family and the “hammers”
Exercises
Test yourself on the chart
0 of 4 correct
1Tap the candle that gives away a big player stepping in.
Tap a candle on the chart.
2Which candle shows that buyers are in control until the end of the period?
3A candle entirely within the range of the previous one is called…
4Tap the inside bar – the candle entirely within the range of the previous one.
Tap a candle on the chart.
Key points
- Compare the body with the average of the last 10–20 candles, not in dollars.
- A close in the upper or lower quarter shows who was in control right to the end.
- A long wick means rejection – it is strongest at a key level.
- Identify patterns on H1, H4 and D1; lower timeframes are for a precise entry.