Section I · The Japanese Candlestick Bible · Chapter 11
Example trades step by step
Eight example trades on simulated XAUUSD charts – context, signal, entry, stop, a 2R target and trade management.
Video · 8 min3 exercises
Video lesson with voice-over and charts · 8 minEnglish subtitles
In this chapter you'll see eight example trades on simulated XAUUSD charts (H1). The goal is to see what the whole process looks like – context, signal, entry, stop and target – on a chart that resembles the real one. The prices are illustrative and for educational purposes only.
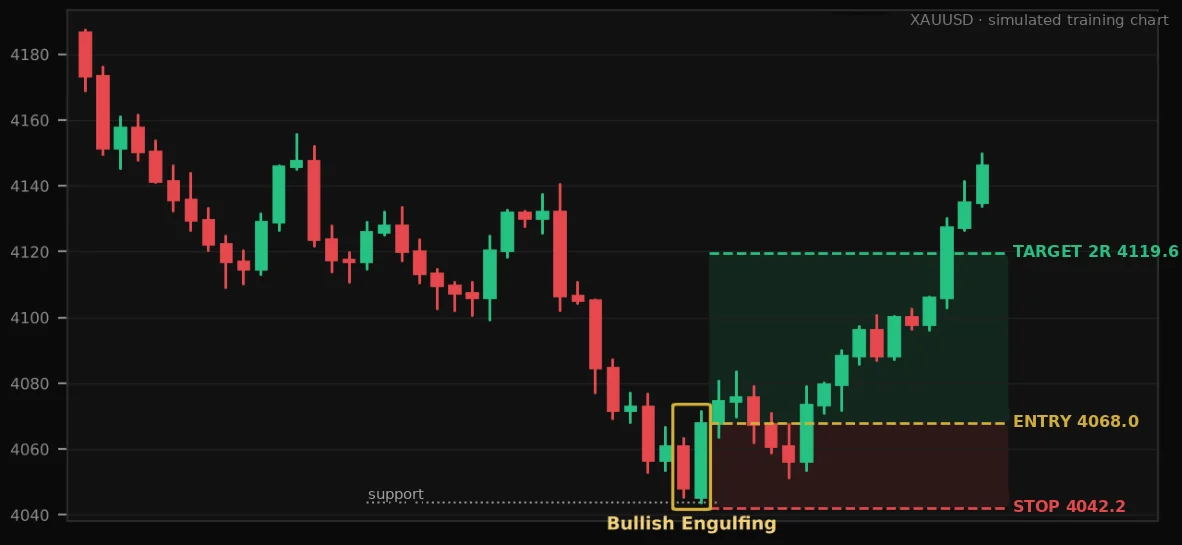
Example 1: Bullish engulfing at support
Direction
LONG (BUY)
Entry
4068.0
Stop-loss
4042.2
Target (2R)
4119.6
Risk
$25.8
Lot at $100 risk
0.04
Context and signal: Price is pulling back to a previous support zone. A small bearish candle forms at the level, followed by a big bullish candle that engulfs it completely – buyers take control right at support.
Management: The stop is beyond the pattern's extreme point (the low) plus a $1.5 buffer for the spread. After a 1R move ($25.8) in our favor, the stop is moved to breakeven. The target is 2R – 4119.6.
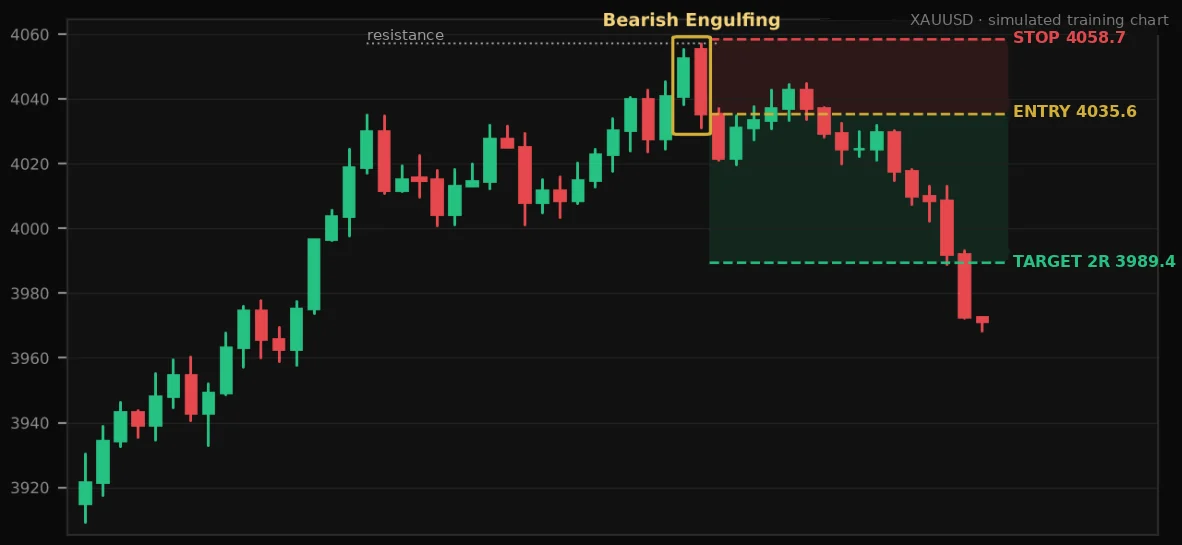
Example 2: Bearish engulfing at resistance
Direction
SHORT (SELL)
Entry
4035.6
Stop-loss
4058.7
Target (2R)
3989.4
Risk
$23.1
Lot at $100 risk
0.04
Context and signal: After a rally, price reaches resistance. The small bullish candle is engulfed by a big bearish one – buyers are exhausted, sellers take over.
Management: The stop is beyond the pattern's extreme point (the high) plus a $1.5 buffer for the spread. After a 1R move ($23.1) in our favor, the stop is moved to breakeven. The target is 2R – 3989.4.
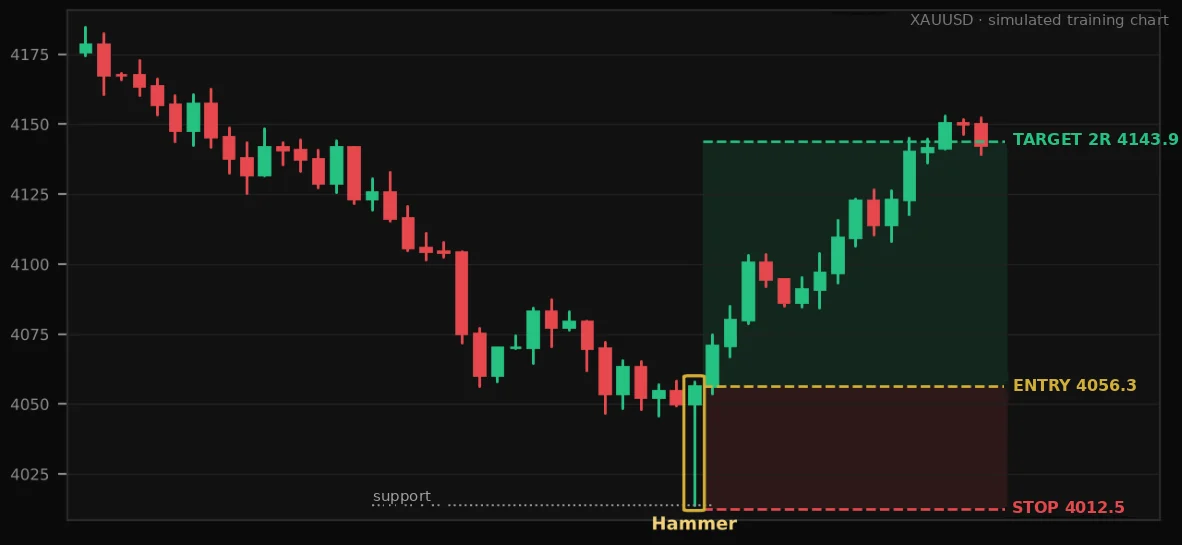
Example 3: Hammer after a sweep of the low
Direction
LONG (BUY)
Entry
4056.3
Stop-loss
4012.5
Target (2R)
4143.9
Risk
$43.8
Lot at $100 risk
0.02
Context and signal: Price falls toward a previous low, the hammer's wick breaks through it (collecting the stops below it) and closes back above the level. A classic rejection.
Management: The stop sits beyond the pattern's extreme point (the low) plus a $1.5 buffer for the spread. After a 1R move ($43.8) in our favor, the stop moves to break-even. The target is 2R – 4143.9.
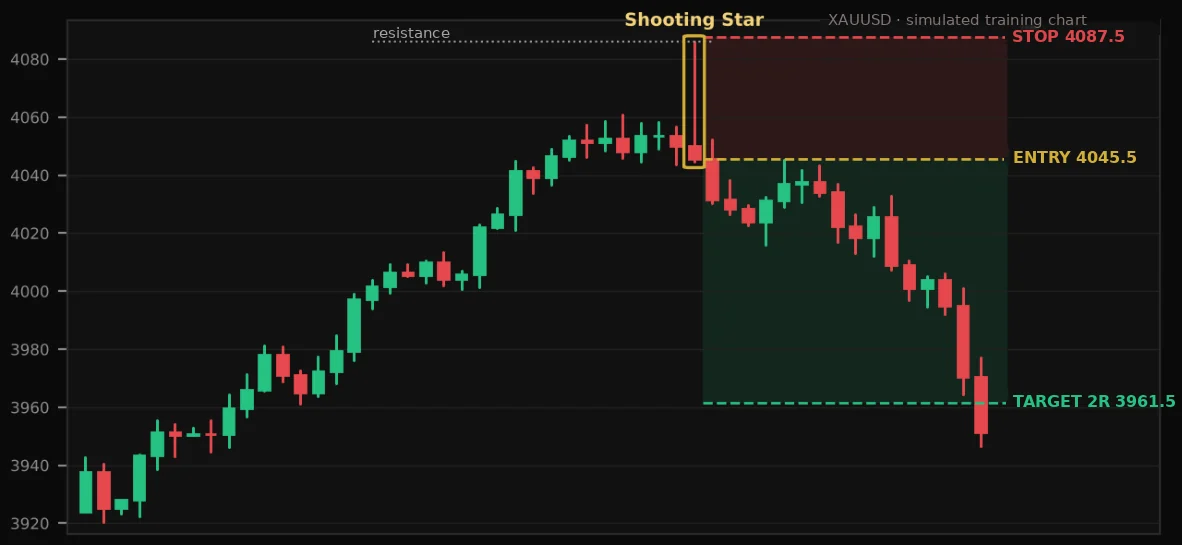
Example 4: Shooting Star at a new high
Direction
SHORT (SELL)
Entry
4045.5
Stop-loss
4087.5
Target (2R)
3961.5
Risk
$42.0
Lot at $100 risk
0.02
Context and signal: Price makes a new high, but the upper wick shows strong rejection. The candle closes near its open, and the next one is bearish – confirmation.
Management: The stop sits beyond the pattern's extreme point (the high) plus a $1.5 buffer for the spread. After a 1R move ($42.0) in our favor, the stop moves to break-even. The target is 2R – 3961.5.
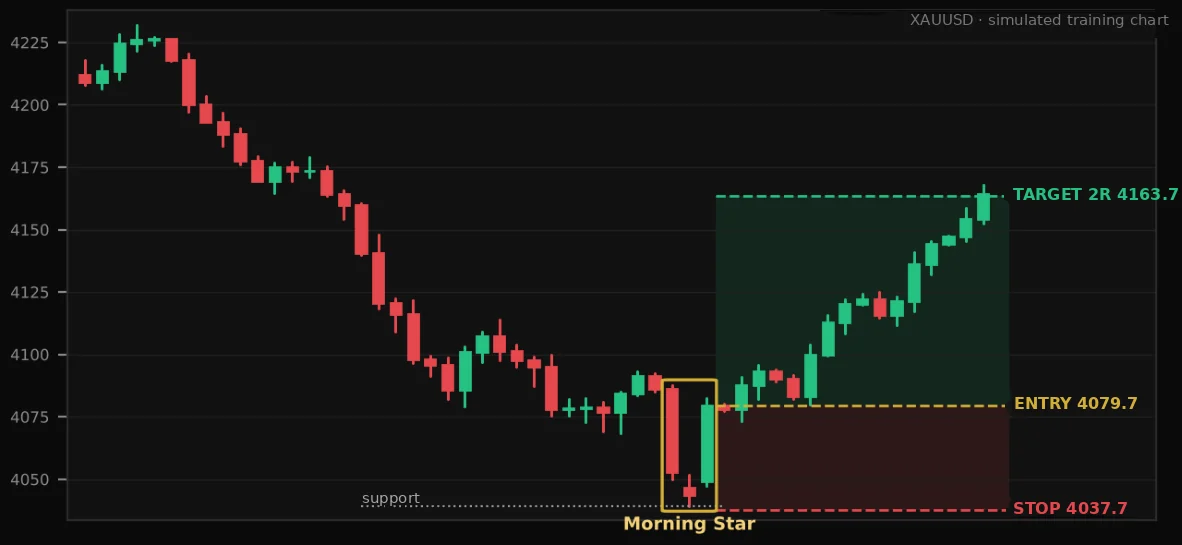
Example 5: Morning Star at the end of a pullback
Direction
LONG (BUY)
Entry
4079.7
Stop-loss
4037.7
Target (2R)
4163.7
Risk
$42.0
Lot at $100 risk
0.02
Context and signal: A big bearish candle, a small star and a strong bullish candle closing above the midpoint of the first. The story is strength → hesitation → reversal.
Management: The stop sits beyond the pattern's extreme point (the low) plus a $1.5 buffer for the spread. After a 1R move ($42.0) in our favor, the stop moves to break-even. The target is 2R – 4163.7.
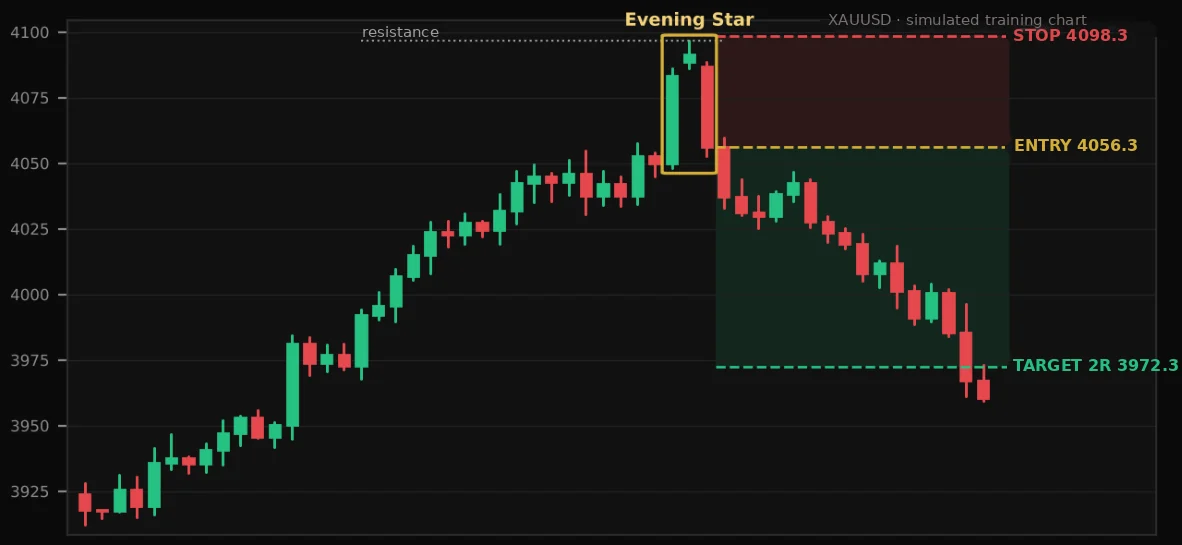
Example 6: Evening Star after an expansion
Direction
SHORT (SELL)
Entry
4056.3
Stop-loss
4098.3
Target (2R)
3972.3
Risk
$42.0
Lot at $100 risk
0.02
Context and signal: After a prolonged rally, an evening star forms. The entry is at the close of the third candle, the stop – above the star.
Management: The stop sits beyond the pattern's extreme point (the high) plus a $1.5 buffer for the spread. After a 1R move ($42.0) in our favor, the stop moves to break-even. The target is 2R – 3972.3.
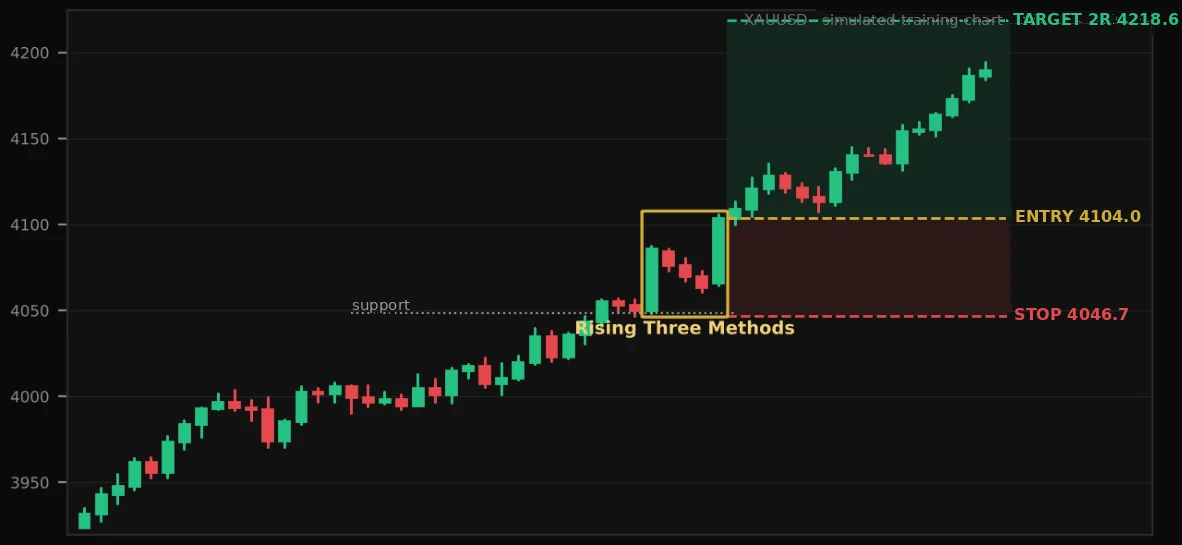
Example 7: Rising Three Methods – continuation
Direction
LONG (BUY)
Entry
4104.0
Stop-loss
4046.7
Target (2R)
4218.6
Risk
$57.3
Lot at $100 risk
0.02
Context and signal: A strong bullish candle, a short pullback of three small candles within its range and a new strong bullish candle. We enter with the trend.
Management: The stop sits beyond the pattern's extreme point (the low) plus a $1.5 buffer for the spread. After a 1R move ($57.3) in our favor, the stop moves to break-even. The target is 2R – 4218.6.
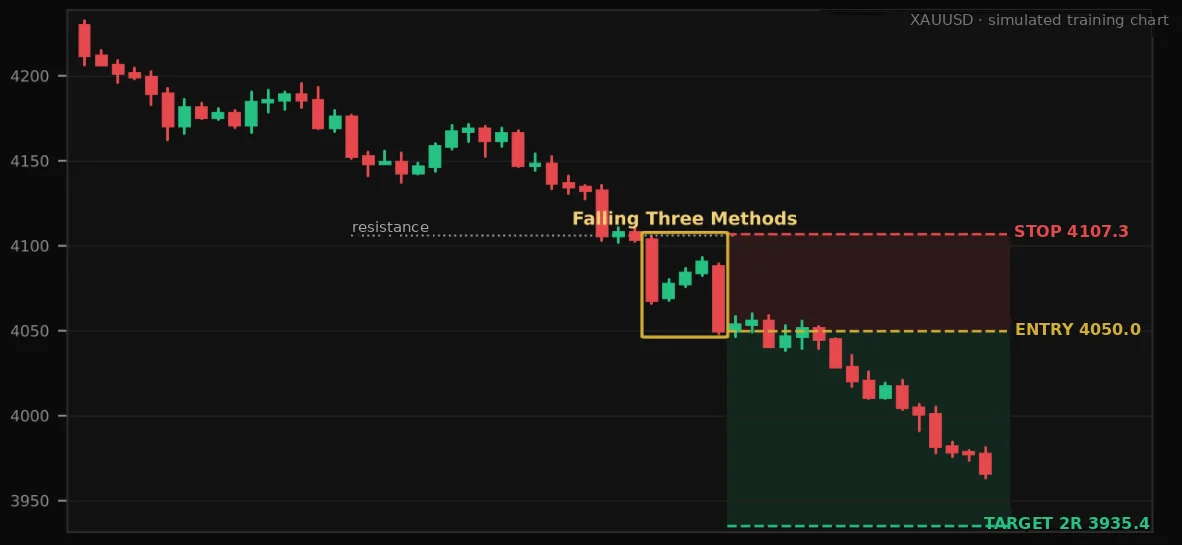
Example 8: Falling Three Methods – continuation
Direction
SHORT (SELL)
Entry
4050.0
Stop-loss
4107.3
Target (2R)
3935.4
Risk
$57.3
Lot at $100 risk
0.02
Context and signal: In a downtrend the market takes a short pause without breaking the open of the big bearish candle. The breakdown is the signal.
Management: The stop sits beyond the pattern's extreme point (the high) plus a $1.5 buffer for the spread. After a 1R move ($57.3) in our favor, the stop moves to break-even. The target is 2R – 3935.4.
Exercises
Test yourself on the chart
0 of 3 correct
1Entry 4068.0, stop 4042.2. What is the target at 2R?
2As in example 6: an “Evening Star” after a long rise. You go short (sell) at the close of the third candle. Where do you put the stop-loss?
Tap the chart where you would put the stop-loss.
3As in example 8: a downtrend and a short pause. Where is price more likely to go?
Key points
Every trade starts with context: level and trend.
The stop goes beyond the extreme point of the pattern plus a buffer for the spread.